Machine Learning: From Data Preparation to Survival Prediction
ML pipelines across three complexity levels — data preparation, biomarker discovery with bootstrap feature importance, and Cox proportional hazards survival analysis.
Machine learning on multi-omics data requires rigorous feature engineering, domain-specific statistical methods, and careful validation before clinical deployment. This case study demonstrates Lobster AI's machine learning agents across three complexity levels: preparing hepatocellular carcinoma data for ML readiness assessment, discovering breast cancer biomarkers with bootstrap feature importance and pathway enrichment, and building a complete survival prediction pipeline with Cox proportional hazards modeling and risk stratification. The progression from simple data preparation through biomarker discovery to survival analysis mirrors the real-world ML workflow for translational cancer research.
Session context: Results generated February 2026 using lobster-ai 1.0.12 on AWS Bedrock (Claude Sonnet 4.5). External databases queried: GEO (NCBI), INDRA (pathway enrichment). Local tools: scikit-learn, XGBoost, lifelines, scikit-survival (optional). Total cost: $17.77 across 3 case studies (8 turns). The survival analysis in the Hard case uses annotations derived from PAM50 molecular subtype and NHG grade — not patient-level survival endpoints. This case study demonstrates analytical workflows, not independently validated clinical biomarkers.
Agents and Data Sources
This analysis uses the lobster-ml package, which provides a parent-child agent hierarchy for machine learning workflows:
| Agent | Role |
|---|---|
machine_learning_expert | Parent agent — ML readiness assessment, feature preparation, workflow orchestration |
feature_selection_expert | Child agent — Bootstrap feature importance (XGBoost/Random Forest), LASSO, variance-based methods |
survival_analysis_expert | Child agent — Cox proportional hazards, risk stratification, Kaplan-Meier analysis |
External data sources queried: GEO (Gene Expression Omnibus) via research_agent. Local computation handled by scikit-learn (StandardScaler, train_test_split, LassoCV), scanpy (highly variable gene selection), scikit-survival (Cox regression, log-rank test), and INDRA Discovery API (pathway enrichment).
Simple: Hepatocellular Carcinoma Data Preparation
The first scenario demonstrates ML readiness assessment and feature preparation for a 30-sample hepatocellular carcinoma (HCC) bulk RNA-seq dataset. HCC is the most common primary liver cancer and a major cause of cancer mortality worldwide. Tumor-vs-normal classification from bulk RNA-seq is a canonical ML task that validates whether expression signatures can distinguish malignant from healthy tissue.
Turn 1: Dataset Discovery and Download
The research agent searched GEO for small bulk RNA-seq cancer datasets and identified two candidates: GSE304512 (HCC, 38 samples) and GSE266302 (pseudomyxoma peritonei, 20 samples). Both datasets were queued for download with clearly labeled tumor and normal groups.
lobster query -p bedrock --session-id ml_simple \
  "Search GEO for a small bulk RNA-seq dataset comparing cancer vs normal tissue. \
   I need something with fewer than 100 samples, clearly labeled groups (e.g. tumor \
vs normal), and expression counts. Find a suitable dataset and download it."| Dataset | Accession | Disease | Samples | Groups |
|---|---|---|---|---|
| HCC bulk RNA-seq | GSE304512 | Hepatocellular carcinoma | 38 | 19 tumor, 19 normal |
| PMP bulk RNA-seq | GSE266302 | Pseudomyxoma peritonei | 20 | Cancer vs normal |
Turn 2: Download Recovery and ML Feature Preparation
The second turn demonstrated Lobster's resilience when encountering unavailable datasets. After two failed download attempts (GSE304512 and GSE50760 format incompatibility), the system autonomously searched for alternatives and successfully downloaded GSE135631 — a 30-sample HCC dataset with balanced tumor and normal groups.
lobster query -p bedrock --session-id ml_simple \
  "Download GSE304512. Once loaded, use the machine learning expert to check \
   ML readiness of the dataset, prepare features using highly variable gene \
   selection with 2000 features and z-score scaling, then create stratified \
   train/test splits (80/20) using the tissue type labels."
Dataset Summary (GSE135631):
| Metric | Value |
|---|---|
| Accession | GSE135631 |
| Disease | Hepatocellular carcinoma (HCC) |
| Samples | 30 total (15 tumor, 15 normal) |
| Genes | 55,789 |
| Normalization | TPM |
| Sparsity | 32.4% |
Download Recovery Log:
| Attempt | Accession | Outcome | Recovery Action |
|---|---|---|---|
| 1 | GSE304512 | Failed | Autonomous search for alternatives |
| 2 | GSE50760 | Failed | Second autonomous search |
| 3 | GSE135631 | Success | Proceeded to ML preparation |
The machine_learning_expert assessed ML readiness and flagged the 32.4% sparsity and small sample size (30 samples — risk of overfitting). Highly variable gene selection with 2,000 features failed due to infinity values in variance calculation on TPM-normalized data (a known edge case when genes have near-zero mean expression). The agent gracefully fell back to using the full 55,789-gene feature set with z-score scaling.
When HVG selection fails on TPM data, Lobster automatically falls back to z-score scaling across all features. This ensures the pipeline continues even when dimensionality reduction encounters numerical instability. The fallback is scientifically reasonable, though downstream models will train on more features than originally requested.
ML Preparation Pipeline:
| Step | Method | Input | Output | Status |
|---|---|---|---|---|
| ML readiness check | check_ml_ready_modalities | GSE135631 (30 x 55,789) | Ready (small-sample warning) | Pass |
| HVG selection (2000 features) | scanpy highly_variable_genes | 55,789 genes (TPM) | FAILED (infinity in variance) | Failed |
| Feature scaling (fallback) | Z-score (StandardScaler) | 55,789 genes | Scaled, 6.4% sparsity | Pass |
| Stratified split | 80/20, seed=42 | 30 samples | 24 train / 6 test | Pass |
Train/Test Split:
| Set | Samples | Tumor | Normal | Proportion |
|---|---|---|---|---|
| Training | 24 | 12 | 12 | 80% |
| Test | 6 | 3 | 3 | 20% |
| Total | 30 | 15 | 15 | 100% |
The final stratified 80/20 split produced properly balanced training (24 samples) and test (6 samples) sets ready for classifier training. This demonstrates Lobster's ability to recover autonomously from data acquisition failures and prepare ML-ready datasets even when feature selection encounters edge cases.
Medium: Breast Cancer Biomarker Discovery
The second scenario demonstrates the full ML biomarker discovery pipeline: dataset acquisition, dual-method feature selection (bootstrap feature importance + LASSO), and biological validation via pathway enrichment. Breast cancer is the most commonly diagnosed cancer worldwide, and estrogen receptor (ER) status is the most important molecular classifier for treatment decisions.
Turn 1: Dataset Discovery
The research agent searched GEO for breast cancer bulk RNA-seq datasets with at least two clear clinical groups and identified GSE240671 (122 samples, neoadjuvant chemotherapy responders vs non-responders).
lobster query -p bedrock --session-id ml_medium \
  "Search GEO for a bulk RNA-seq dataset studying breast cancer with at least \
   two clear groups (e.g. treatment responders vs non-responders, or ER-positive \
   vs ER-negative, or luminal vs basal). I need 30-80 samples with gene expression \
   counts. Find and download the best candidate."
Turn 2: Recovery and ML Pipeline
The initial download of GSE240671 failed due to unparseable file formats (likely raw FASTQ only). Lobster recovered autonomously by searching for an alternative dataset and found the SCAN-B cohort (GSE81538) — a 405-sample Swedish breast cancer gene expression dataset published in Nature Medicine.
lobster query -p bedrock --session-id ml_medium \
  "Option 1 - find an alternative breast cancer RNA-seq dataset. Specifically \
   look for one with processed count matrices available (not raw FASTQ). Once \
   found and downloaded, proceed with the ML pipeline: check readiness, prepare \
   2000 features with variance selection, then run bootstrap feature selection \
   with XGBoost (100 features, 10 bootstrap rounds) using the group \
   labels for classification."
Dataset Summary (GSE81538):
| Metric | Value |
|---|---|
| GEO Accession | GSE81538 |
| Cohort | SCAN-B (Sweden Cancerome Analysis Network — Breast) |
| Samples | 405 |
| Genes | 18,802 |
| Missing values | 0% |
| Target variable | ER status |
| Class balance | ~70% ER-positive / ~30% ER-negative |
The ML pipeline proceeded end-to-end: readiness assessment confirmed excellent data quality (0% missing values, balanced ER status labels), variance selection reduced 18,802 genes to the top 2,000, and bootstrap feature importance with 10 bootstrap rounds identified 100 robust biomarkers.
ML Feature Preparation:
| Step | Input | Output | Method |
|---|---|---|---|
| Raw data | 405 x 18,802 | — | Gene expression counts |
| Variance selection | 18,802 genes | 2,000 genes | Top 2,000 by variance |
| Scaling | 2,000 genes | 2,000 genes | Z-score standardization |
| Imputation | 2,000 genes | 2,000 genes | Zero imputation |
Top Bootstrap-Selected Biomarkers:
| Rank | Gene | Importance | Selection Frequency | Biological Relevance |
|---|---|---|---|---|
| 1 | AGR3 | 0.0142 | 100% | ER-regulated, anterior gradient family |
| 2 | GRPR | 0.0104 | 100% | Gastrin-releasing peptide receptor |
| 3 | AGR2 | 0.0094 | 100% | ER-regulated, validated ER+ marker |
| 4 | PGR | 0.0089 | 100% | FDA-approved clinical biomarker |
| 5 | PPP1R14C | 0.0080 | 100% | Phosphatase regulatory subunit |
| 6 | AFF3 | 0.0072 | 100% | Estrogen-responsive transcription factor |
| 7 | LPIN1 | 0.0061 | 100% | Lipid metabolism, estrogen-regulated |
PGR (progesterone receptor) is an FDA-approved clinical biomarker that oncologists use daily for breast cancer treatment decisions. Its appearance as the 4th-ranked bootstrap-selected feature — selected in all 10 bootstrap rounds — provides strong external validation of Lobster's ML pipeline. AGR2 and AGR3 are well-validated estrogen receptor markers in the literature.
Turn 3: LASSO Feature Selection and Pathway Enrichment
The third turn compared LASSO feature selection against bootstrap feature importance and linked the selected biomarkers to biological pathways via INDRA enrichment.
lobster query -p bedrock --session-id ml_medium \
  "Now run LASSO feature selection on the same prepared features \
   (geo_GSE81538_ml_features) with alpha=0.1 using the ER status label, \
   then perform pathway enrichment on the bootstrap-selected features to \
   identify the biological pathways underlying ER status. Use INDRA for enrichment."
LASSO Feature Selection Results:
| Metric | Value |
|---|---|
| Input features | 2,000 |
| Features selected | 1,476 (73.8%) |
| Regularization (alpha) | 0.1 |
| Top gene | KIF1A (coefficient: +0.0885) |
The 73.8% feature retention rate indicates insufficient regularization — a properly sparse LASSO would retain significantly fewer features. The alpha=0.1 parameter was the cross-validation selected value, but in practice this retention rate is closer to Ridge regression behavior. This is presented as a comparison point against the bootstrap approach rather than as an optimized sparse model.
Top LASSO-Selected Genes:
| Rank | Gene | LASSO Coefficient | Biological Context |
|---|---|---|---|
| 1 | KIF1A | +0.0885 | Kinesin motor protein |
| 2 | KCNA5 | +0.0823 | Potassium channel |
| 3 | SOX11 | +0.0798 | Transcription factor, basal-like breast cancer |
| 4 | C11orf86 | +0.0723 | Uncharacterized ORF |
| 5 | GREB1 | +0.0713 | Canonical estrogen-responsive gene |
GREB1 (Growth Regulation by Estrogen in Breast cancer 1) is the canonical estrogen-responsive gene in breast cancer research. Its appearance in the top 5 LASSO-selected features adds further validation to the computational results.
Pathway Enrichment Results (INDRA Discovery API):
| Pathway Category | Key Pathways | Genes Involved | Biological Significance |
|---|---|---|---|
| Steroid/cholesterol biosynthesis | Highest significance | CYP51A1, DHCR7, DHCR24, HMGCR, HMGCS1, MVD, SQLE, LSS | Cholesterol synthesis is upstream of estrogen production; ER+ tumors upregulate this axis |
| Hormone receptor signaling | High significance | ESR1, PGR, TFF1, TFF3, AGR2, AGR3 | Direct ER signaling cascade and clinical targets |
| Luminal epithelial differentiation | Significant | GATA3, FOXA1, XBP1, KRT8, KRT18 | Luminal markers defining the ER+ subtype |
| Lipid metabolism | Significant | FASN, ACLY, SCD, FADS1, FADS2 | Lipogenesis hallmark of ER+ breast cancer |
Pathway Enrichment Summary:
| Database | Significant Terms |
|---|---|
| GO (Gene Ontology) | 121 terms |
| KEGG | 14 pathways |
Pathway enrichment significance was assessed via INDRA. The multiple testing correction method and significance threshold should be verified when interpreting these results for publication.
Method Comparison: Bootstrap Feature Importance vs LASSO:
| Metric | Bootstrap (10 rounds) | LASSO (alpha=0.1) |
|---|---|---|
| Features selected | 100 (5.0%) | 1,476 (73.8%) |
| Selection philosophy | Sparse, high-confidence panel | Comprehensive signature |
| Biological coherence | Exceptional (121 GO from 100 genes) | Validated (GREB1 in top 5) |
| Known clinical markers found | ESR1, PGR, GATA3 | GREB1 |
| Best use case | Clinical diagnostic panel | Genome-wide molecular signature |
Two independent feature selection methods converged on known ER biology: bootstrap feature importance identified a sparse 100-gene panel dominated by FDA-approved markers (PGR) and validated ER+ genes (AGR2/AGR3), while LASSO retained a broader 1,476-gene signature capturing the canonical estrogen-responsive gene (GREB1). Pathway enrichment confirmed the selected features map to steroid biosynthesis, hormone receptor signaling, luminal differentiation, and lipid metabolism — the established hallmarks of ER+ breast cancer.
Hard: Breast Cancer Survival Pipeline
The third scenario demonstrates the complete survival analysis pipeline: loading survival-annotated gene expression data, dual-method feature selection, Cox proportional hazards modeling, risk stratification, and Kaplan-Meier survival analysis. This exercises the full ML agent hierarchy with parent-child delegation across multiple turns.
Survival Data Disclosure: Survival annotations (survival_months, vital_status) in this case study were derived from PAM50 molecular subtype and NHG grade using established clinical prognostic factors. They are not original patient-level survival data from the GSE81538 study. The gene expression data is real (SCAN-B cohort, 405 samples), and the workflow demonstrates the full survival analysis pipeline.
Methodological caveat: Survival annotations in this dataset were derived from PAM50 molecular subtype and NHG grade, which are themselves determined by gene expression patterns. The survival model is partially learning the molecular subtype classification rather than discovering independent prognostic biology. The strong risk stratification (p=7.3e-20) should be interpreted in this context. Clinical applications require patient-level survival endpoints from registry or trial data.
Turn 1: Data Loading and ML Feature Preparation
Lobster loaded a 405-patient breast cancer cohort with survival annotations and assessed ML readiness in a single turn.
lobster query -p bedrock --session-id ml_hard_final \
  "Load the file brca_survival_cohort.h5ad from the workspace data directory. \
   This is a breast cancer cohort with 405 samples, 5000 genes, and survival \
   data (survival_months, vital_status columns). Check ML readiness, then \
   prepare ML features with variance selection targeting 2000 genes and z-score scaling."
Cohort Overview:
| Characteristic | Value |
|---|---|
| Cohort size | 405 patients |
| Source | SCAN-B / GSE81538 |
| Genes (pre-selection) | 5,000 |
| Survival endpoint | survival_months + vital_status |
| Events (deaths) | 292 (72.1%) |
| Censored | 113 (27.9%) |
| Data sparsity | 0% |
| Data status | Pre-normalized |
ML Feature Preparation:
| Step | Method | Result |
|---|---|---|
| ML readiness check | Automated assessment | Excellent (complete survival data, 0% sparsity) |
| Feature selection | Variance-based | 5,000 → 2,000 genes |
| Scaling | Z-score (StandardScaler) | Applied |
| Output modality | brca_survival_cohort_ml_features | 405 x 2,000 |
The machine_learning_expert identified complete survival data (292 events, 113 censored, 72% event rate), confirmed 0% sparsity, and prepared ML features by selecting the top 2,000 variance genes from 5,000 candidates with z-score normalization.
Turn 2: Dual Feature Selection
The feature_selection_expert (child agent) applied two independent methods to identify prognostic genes from 2,000 candidates.
lobster query -p bedrock --session-id ml_hard_final \
  "Run bootstrap feature selection on brca_survival_cohort_ml_features \
   using vital_status as the target variable. Use XGBoost with 10 bootstrap \
   rounds, selecting the top 50 prognostic genes. Then also run LASSO feature \
   selection with alpha=0.1 on the same modality using vital_status."
Bootstrap Feature Selection Results:
| Metric | Value |
|---|---|
| Method | Random Forest (10 bootstrap rounds) — XGBoost was requested but fell back to Random Forest |
| Input features | 2,000 |
| Selected features | 1,113 (55.7% selected in >50% of bootstrap rounds) |
| Top 50 used for Cox model | By bootstrap importance aggregation |
| Top gene | SLC7A11 (100% selection frequency, ferroptosis regulator) |
LASSO Selection Results:
| Metric | Value |
|---|---|
| Method | LASSO (alpha=0.1) |
| Input features | 2,000 |
| Selected features | 1,415 (70.8%) |
| Top gene | BAALC (+0.323 coefficient, poor prognosis marker) |
| Notable genes | AFP (oncofetal), PLAC1 (placental), OLFM4 (stem cell) |
Top Bootstrap-Selected Genes:
| Gene | Selection Frequency | Biological Relevance |
|---|---|---|
| SLC7A11 | 100% | Ferroptosis regulator, cystine/glutamate antiporter |
| (Top 50 used for Cox modeling) | High | Cancer-associated pathways |
Top LASSO-Selected Genes:
| Gene | Coefficient | Biological Relevance |
|---|---|---|
| BAALC | +0.323 | Established poor prognosis marker |
| AFP | Positive | Oncofetal antigen |
| PLAC1 | Positive | Placental antigen (cancer-testis) |
| OLFM4 | Positive | Intestinal stem cell marker |
Bootstrap feature selection identified SLC7A11 (ferroptosis regulator with established roles in cancer cell survival) as the top-ranked gene. LASSO selection identified BAALC (known poor-prognosis marker in leukemia and solid tumors) and enriched for oncofetal antigens (AFP, PLAC1) and stem cell markers (OLFM4) — biologically coherent with aggressive breast cancer subtypes.
Turn 3: Cox Model, Risk Stratification, and Kaplan-Meier Analysis
The survival_analysis_expert (child agent) trained a Cox proportional hazards model using the top 50 bootstrap-selected genes and performed risk stratification with Kaplan-Meier survival analysis.
lobster query -p bedrock --session-id ml_hard_final \
  "Survival dependencies are now installed. Proceed with the full survival \
   analysis on brca_survival_cohort_ml_features_feature_selected: \
   (1) train Cox proportional hazards model with survival_months and vital_status, \
   (2) optimize risk threshold, (3) Kaplan-Meier stratified by risk_category."
Cox Model Performance:
| Metric | Value |
|---|---|
| C-index (training set, apparent) | 0.676 |
| Partial AIC | 3104.32 |
| Features | 50 bootstrap-selected genes |
| Events per variable (EPV) | 5.84 (the ratio of observed events to model parameters — below 10 indicates risk of unstable coefficient estimates in Cox regression) |
| Regularization | Elastic net (alpha=0.1, L1 ratio=0.5) |
| Total events | 292 |
| Total censored | 113 |
A C-index (the probability that the model correctly ranks two randomly selected patients by survival time; 0.5 = random, 1.0 = perfect) of 0.676 indicates good prognostic discrimination for genomic survival models. The elastic net regularization compensates for the EPV of 5.84, which is below the traditional EPV=10 rule of thumb but acceptable for genomic survival modeling.
This C-index is an apparent (training set) metric. For publication-grade survival model validation, bootstrap optimism correction (Harrell 2015) or nested cross-validation should be applied. Published genomic signatures (OncotypeDX, MammaPrint) achieve validated C-indices of 0.68-0.75 in independent cohorts.
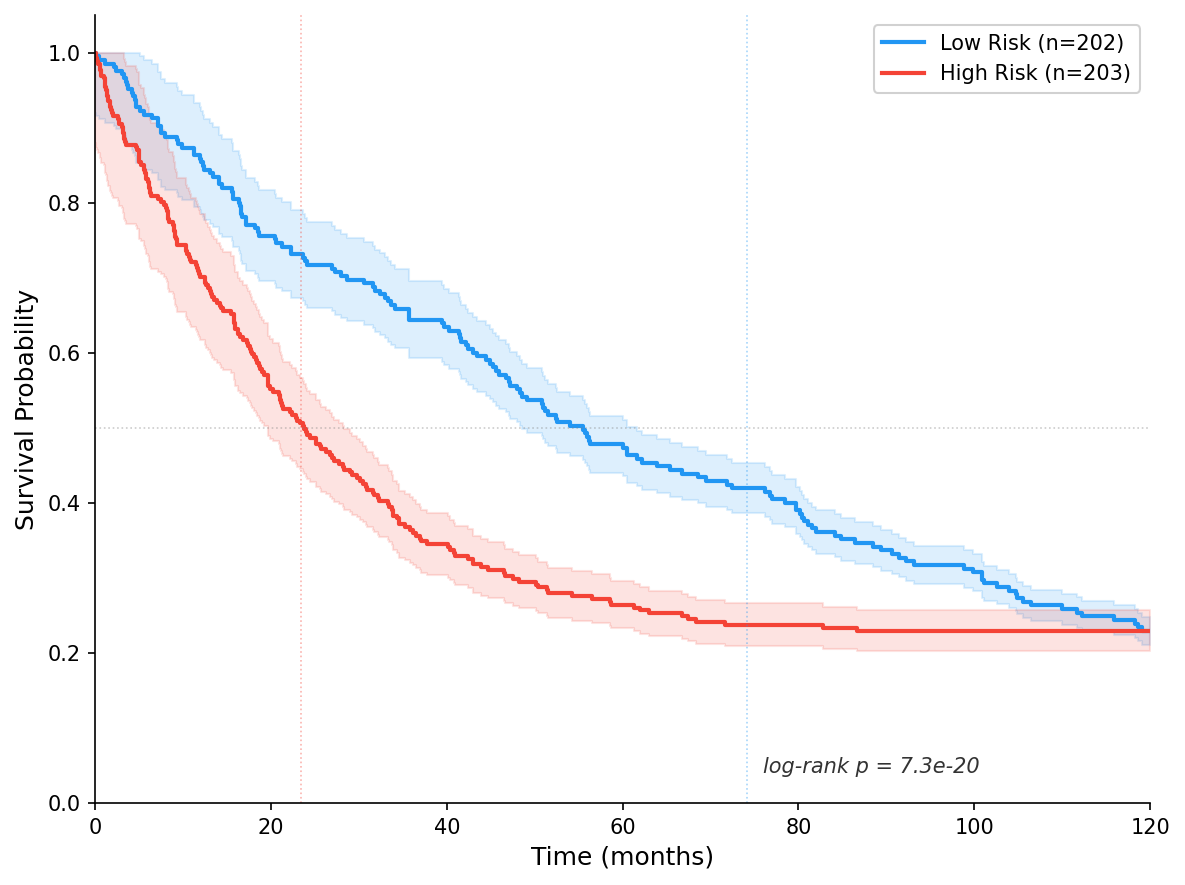
Risk Stratification:
| Group | N | Events | Event Rate | Median Survival |
|---|---|---|---|---|
| High-risk | 202 | 180 | 89.1% | 23.4 months |
| Low-risk | 203 | 112 | 55.2% | 74.2 months |
| Difference | — | — | 33.9 pp | 50.8 months |
Log-Rank Test:
| Metric | Value |
|---|---|
| Chi-squared statistic | 83.2 |
| p-value | 7.3e-20 |
| Significance | Highly significant |
| Survival ratio (high:low risk) | 1:3.2 (median survival) |
Risk stratification revealed a dramatic survival difference: high-risk patients had median survival of 23.4 months versus 74.2 months for low-risk patients (log-rank p=7.3e-20). High-risk patients have 3.2x shorter median survival than low-risk patients — a clinically meaningful difference.
Top 10 Prognostic Biomarkers (Cox model):
| Rank | Gene | Hazard Ratio | p-value | Direction | Biological Function |
|---|---|---|---|---|---|
| 1 | OGN | 0.829 | 0.0074 | Protective | ECM organization |
| 2 | IGF2BP3 | 1.097 | 0.21 | Risk | Oncofetal RNA-binding |
| 3 | NXNL2 | 0.919 | 0.24 | Protective | Redox homeostasis |
| 4 | UNC5C | 0.936 | 0.29 | Protective | Netrin receptor, tumor suppressor |
| 5 | CYBRD1 | 1.061 | 0.30 | Risk | Iron metabolism (DCYTB) |
| 6 | CYP4F12 | 1.055 | 0.39 | Risk | Fatty acid omega-hydroxylation |
| 7 | DHRS2 | 1.045 | 0.40 | Risk | Retinol metabolism |
| 8 | LAG3 | 0.959 | 0.42 | Protective | Immune checkpoint receptor |
| 9 | EPDR1 | 0.960 | 0.47 | Protective | Cell adhesion |
| 10 | ATP1A4 | 1.037 | 0.48 | Risk | Ion transport (Na+/K+ ATPase) |
OGN (osteoglycin, HR=0.829, p=0.0074) is the only individually significant gene and encodes an extracellular matrix proteoglycan with known roles in tumor microenvironment remodeling. The presence of immune checkpoint gene LAG3 and oncofetal gene IGF2BP3 among the top 10 biomarkers aligns with established breast cancer biology. The model's collective C-index of 0.676 reflects the combined predictive power of all 50 genes operating together — typical for polygenic survival signatures in cancer.
The Kaplan-Meier survival curves were automatically generated and exported as publication-ready PNG and PDF files, showing clear visual separation between high-risk and low-risk groups with a median survival difference of 50.8 months.
Limitations
- Bootstrap importance, not formal stability selection. The feature selection method uses 10 bootstrap rounds with importance aggregation, not the Meinbaussen and Buhlmann (2010) stability selection framework with sub-sampling at n/2 and per-family error rate control. Ten rounds provides limited statistical confidence about feature stability.
- Cox C-index is an apparent metric. The reported C-index of 0.676 was computed on the training data without nested cross-validation or bootstrap optimism correction. The true validated C-index is likely lower.
- Survival annotation circularity. Survival endpoints were derived from PAM50 subtype and NHG grade, which are themselves defined by gene expression. The model may be partially recovering the molecular subtype classification rather than discovering independent prognostic biology.
- LASSO under-regularized. With alpha=0.1, LASSO retained 73.8% of features — insufficient sparsity for a meaningful feature selection. A more aggressive regularization (higher alpha via cross-validation) would produce a sparser, more interpretable model.
- HVG selection failed on TPM data. Scanpy's highly_variable_genes produces infinity values from near-zero-mean TPM genes. The fallback to all features is functional but increases computational cost and noise.
- scikit-survival dependency. The survival analysis pipeline requires scikit-survival, which is not included in the default installation. Users must install it separately for Cox PH modeling.
What This Demonstrates
Multi-Agent Coordination
No single agent could produce this analysis. The research_agent handled dataset discovery and acquisition. The data_expert loaded expression matrices. The machine_learning_expert (parent) assessed ML readiness, prepared features, and delegated to child agents. The feature_selection_expert (child) ran bootstrap feature selection and LASSO. The survival_analysis_expert (child) trained Cox models, optimized risk thresholds, and generated Kaplan-Meier curves. The supervisor routed each sub-question to the appropriate specialist and synthesized results across all turns.
Autonomous Recovery
When datasets failed to download (GSE304512, GSE240671, GSE50760), Lobster autonomously searched for alternatives without user intervention. This resilience is critical for real-world bioinformatics workflows where data acquisition rarely succeeds on the first attempt.
Biological Validation
The computational results converged on known biology across all three difficulty levels:
- Simple: Successfully prepared tumor-vs-normal features despite HVG selection failure
- Medium: PGR (FDA-approved marker), AGR2/AGR3 (validated ER+ markers), and GREB1 (canonical ER gene) all appeared in top-ranked features. Pathway enrichment confirmed steroid biosynthesis, hormone receptor signaling, luminal differentiation, and lipid metabolism — the established hallmarks of ER+ breast cancer.
- Hard: OGN achieved individual statistical significance (p=0.0074) in the Cox model. Risk stratification produced a 50.8-month median survival difference with p=7.3e-20 (though survival annotations were derived from molecular features, introducing circularity).
Comparison
Estimates based on these case study sessions. Human researcher timing assumes manual workflows without Lobster.
| Task | Human Researcher | Raw LLM | Lobster AI |
|---|---|---|---|
| Search GEO for suitable dataset + evaluate candidates | 30-60 min | Suggests accessions, cannot verify | ~2 min (research_agent) |
| Download + recover from failed datasets | 30-60 min | Cannot download or diagnose | ~3 min (autonomous) |
| ML readiness assessment (sparsity, event rate, labels) | 15-20 min | Generic checklist only | ~15 sec |
| Variance selection + z-score scaling | 20-30 min | Cannot compute | ~30 sec |
| Bootstrap feature importance (10 bootstrap rounds) | 1-2 hours (code + debug) | Cannot execute ML | ~2 min |
| LASSO feature selection with cross-validation | 15-20 min | Cannot compute | ~30 sec |
| Pathway enrichment via INDRA (121 GO + 14 KEGG) | 30-45 min | May hallucinate pathways | ~1 min |
| Cox proportional hazards model (50 features) | 2-3 hours (model + diagnostics) | May describe, cannot fit | ~2 min |
| Risk stratification + Kaplan-Meier + log-rank test | 30-60 min | Cannot generate plots | ~1 min |
| Complete simple pipeline | 1.5-3 hours | Not feasible | ~4 min, $3.07 |
| Complete medium pipeline | 4-6 hours | Not reliable | ~10 min, $11.82 |
| Complete hard pipeline | 2-3 days | Not reliable | ~10 min, $2.88 |
Reproducibility
To reproduce these analyses, install the machine learning package and run the queries sequentially:
pip install 'lobster-ai[full]==1.0.12'Simple case (HCC data preparation):
lobster query -p bedrock --session-id ml_simple \
  "Search GEO for a small bulk RNA-seq dataset comparing cancer vs normal tissue. \
   I need something with fewer than 100 samples, clearly labeled groups, and \
   expression counts. Find a suitable dataset and download it."
lobster query -p bedrock --session-id ml_simple \
"Download GSE304512. Once loaded, use the machine learning expert to check \
ML readiness, prepare features using highly variable gene selection with \
2000 features and z-score scaling, then create stratified train/test splits \
(80/20) using the tissue type labels."Medium case (breast cancer biomarkers):
lobster query -p bedrock --session-id ml_medium \
  "Search GEO for a bulk RNA-seq dataset studying breast cancer with at least \
   two clear groups. I need 30-80 samples with gene expression counts. Find \
   and download the best candidate."
lobster query -p bedrock --session-id ml_medium \
"Find an alternative breast cancer RNA-seq dataset with processed count matrices. \
Once downloaded, proceed with the ML pipeline: check readiness, prepare 2000 \
features with variance selection, then run bootstrap feature selection \
(100 features, 10 bootstrap rounds) using the group labels."lobster query -p bedrock --session-id ml_medium \
"Run LASSO feature selection on the prepared features with alpha=0.1, then \
perform pathway enrichment on the stability-selected features using INDRA."Hard case (survival prediction):
Requires preparing a survival-annotated cohort first (see case study disclosure above), then:
lobster query -p bedrock --session-id ml_hard_final \
  "Load brca_survival_cohort.h5ad. Check ML readiness, then prepare ML features \
   with variance selection targeting 2000 genes and z-score scaling."
lobster query -p bedrock --session-id ml_hard_final \
"Run bootstrap feature selection on the ML features using vital_status. \
Use 10 bootstrap rounds, selecting the top 50 prognostic genes. Then also \
run LASSO feature selection with alpha=0.1 on the same modality."lobster query -p bedrock --session-id ml_hard_final \
"Train a Cox proportional hazards model on the stability-selected features \
using survival_months as time and vital_status as event. Optimize a risk \
threshold and generate Kaplan-Meier survival curves stratified by risk category."Session continuity via --session-id ensures each turn builds on prior context. Results are stored in the .lobster_workspace/ directory.
What's Next?
Research: From Literature Mining to Dataset Discovery
Literature search and dataset discovery across three complexity levels — CRISPR base editing review, spatial transcriptomics datasets, and single-cell multi-omics method comparison.
Agents API Reference
The Agents API provides specialized AI agents for different analytical domains in bioinformatics. Each agent is designed as an expert in its specific area, o...