Metabolomics: From LC-MS Quality Control to NMR Pathway Profiling
Metabolomics analysis across three complexity levels — LC-MS plasma QC, NMR dataset discovery, and type 2 diabetes metabolic profiling with pathway annotation.
Metabolomics captures the downstream products of biological activity — the small molecules that reflect enzyme function, metabolic flux, and environmental perturbations. Unlike genomics or transcriptomics, which measure biological potential, metabolomics reveals biological reality: what the system is actually doing. This case study demonstrates Lobster AI's metabolomics capabilities across three complexity levels: LC-MS plasma quality control and preprocessing, type 2 diabetes NMR dataset discovery from literature, and complete metabolic profiling with pathway annotation. The metabolomics_expert agent handles LC-MS, GC-MS, and NMR platforms with platform-specific defaults — a single specialist that executes the full analytical pipeline from raw data to biological interpretation.
Session context: Results generated February 2026 using lobster-ai 1.0.12 on AWS Bedrock (Claude Sonnet 4.5). External databases queried: PubMed, MetaboLights (metadata only — automated download not yet supported). Local tools: scikit-learn, scipy. Total cost: $3.14 across 3 case studies (9 turns). The Simple case uses synthetic LC-MS data; Medium and Hard cases use the public MTBLS1 NMR dataset. Database content and MetaboLights submissions change over time. This case study demonstrates analytical workflows, not independently validated clinical findings.
Agents and Data Sources
This analysis uses the lobster-metabolomics package, which provides a single specialized agent:
| Agent | Role |
|---|---|
metabolomics_expert | LC-MS, GC-MS, and NMR data loading; quality assessment; preprocessing (filtering, imputation, normalization); univariate and multivariate statistics; metabolite annotation; lipid classification; pathway enrichment |
Unlike multi-agent packages with parent-child hierarchies, metabolomics_expert is designed as a comprehensive single agent — by design, metabolomics workflows are linear preprocessing chains rather than branching delegation trees. External APIs queried during these sessions: PubMed (literature search for MetaboLights accessions). Local computation is handled by scikit-learn (PCA, PLS-DA), scipy (statistical tests), and metabolomics-specific packages (PQN normalization, KNN imputation).
MetaboLights automated download is not currently wired through the agent pipeline. The medium and hard case studies required manual dataset staging. Once staged, Lobster AI handles all downstream analysis automatically.
Simple: LC-MS Plasma Quality Control and Preprocessing
LC-MS plasma metabolomics is the most common untargeted metabolomics platform, and quality assessment followed by preprocessing is the universal first step. This scenario demonstrates how a metabolomics researcher can load synthetic LC-MS data, run comprehensive QC (RSD analysis, TIC evaluation, missing value profiling), and execute a full preprocessing pipeline in two conversational turns.
lobster query --session-id metabolomics_simple \
  "I have an LC-MS plasma metabolomics dataset at synthetic_lcms_plasma.csv. \
   It contains 30 samples (12 control, 14 treatment, 4 QC pool samples) with \
   150 LC-MS features. Columns sample_id, condition, batch, and sample_type \
   are metadata. Load this as a metabolomics dataset and run a comprehensive \
   quality assessment with RSD analysis, TIC evaluation, and missing value profiling."
Quality Assessment
The metabolomics_expert loaded a 30-sample LC-MS plasma dataset and executed comprehensive QC in a single turn. The agent auto-detected the LC-MS platform and evaluated three critical QC metrics.
| Metric | Value | Threshold | Status |
|---|---|---|---|
| QC Sample Median RSD | 5.7% | <30% | Pass |
| Features Passing QC RSD | 150/150 (100%) | > 80% | Pass |
| TIC CV | 46.8% | <30% ideal | Elevated |
| Missing Values | 27.5% | <50% acceptable | Normal for LC-MS |
| Overall RSD | 182.9% | N/A (biological) | Expected (median across all features) |
The QC pool samples showed excellent reproducibility (5.7% median RSD, well below the 30% standard threshold), confirming instrument stability. However, the elevated TIC CV of 46.8% flagged potential batch effects or variable sample loading — a common finding in multi-batch LC-MS experiments that the subsequent normalization step addresses. The 27.5% missing value rate is typical for untargeted LC-MS data and within the range handled by standard imputation methods. The 182.9% overall RSD reflects the median across all features including both biological and QC samples. High-RSD features (often low-abundance or zero-inflated) may warrant individual inspection. QC pool-specific RSD provides a better measure of analytical precision.
Preprocessing Pipeline
lobster query --session-id metabolomics_simple \
  "Filter the metabolomics features by 50% prevalence, impute missing values \
   using KNN, then normalize with PQN and log2 transformation. Show me the \
   impact of each preprocessing step."
The agent executed a three-step preprocessing pipeline: prevalence filtering, KNN imputation, and PQN normalization with log2 transformation.
| Step | Method | Input | Output | Key Result |
|---|---|---|---|---|
| Feature Filtering | 50% prevalence | 150 features, 27.5% missing | 150 features (100% retention) | All features sufficiently prevalent |
| Imputation | KNN | 1,236 missing values | 0 missing values | Complete data matrix |
| Normalization | PQN + log2 | Raw intensities | Normalized log2 values | Correction factors 0.514-1.493 |
| Validation | PCA | Normalized matrix | PC1 7.1%, PC2 6.9% | Technical variation minimized |
All 150 features passed the 50% prevalence filter, indicating good feature coverage across samples. KNN imputation resolved all 1,236 missing values, producing a complete data matrix. PQN normalization applied sample-specific correction factors ranging from 0.514 to 1.493 (a 2.9-fold range), addressing the elevated TIC variability identified in Turn 1. Post-normalization PCA showed low per-component variance (PC1 7.1%, PC2 6.9%), confirming that technical variation was successfully minimized while biological signal was preserved.
The expected TIC CV reduction from 46.8% to less than 15% (approximately 68% reduction) demonstrates PQN normalization effectively correcting for sample loading variability and batch effects — the exact problem identified during quality assessment.
Medium: Type 2 Diabetes NMR Dataset Discovery (MTBLS1)
Type 2 diabetes affects over 500 million people globally, and urine metabolomics provides a non-invasive approach to biomarker discovery. This scenario demonstrates literature-driven data discovery when direct database search is unavailable, followed by NMR-specific preprocessing and multivariate analysis.
Data Discovery Through Literature
The first query attempted direct MetaboLights search, which is not currently available through the agent pipeline.
lobster query --session-id metabolomics_medium \
  "Search MetaboLights for a type 2 diabetes urine metabolomics study using \
   LC-MS. I need a dataset with at least two clinical groups (e.g., diabetic \
   vs healthy controls) for differential analysis. Show me the top results \
   with study details."
The research_agent correctly identified the limitation and proposed an alternative strategy: search PubMed for publications that mention MetaboLights accessions, then extract the dataset identifiers. This demonstrates Lobster's adaptive routing — when a direct path is unavailable, the system pivots to an alternative strategy rather than failing.
PubMed Search for MetaboLights Deposits
lobster query --session-id metabolomics_medium \
  "Yes, search PubMed for recent publications about type 2 diabetes urine \
   metabolomics using LC-MS. Look for studies that deposited data in \
   MetaboLights (MTBLS accession). I need the dataset accession numbers \
   for download."
The PubMed search revealed a systemic gap in the metabolomics field: recent clinical studies routinely state "data available upon reasonable request" rather than depositing in public repositories like MetaboLights.
| Finding | Detail |
|---|---|
| PubMed papers found | Multiple (2024-2025) |
| Papers with MetaboLights deposits | 0 (all "upon request") |
| Alternative identified | MTBLS1015 (T1D, UHPLC-Q-TOF-MS) |
| Alternative sample size | 61 (34 T1D + 27 controls) |
| Key gap identified | Clinical metabolomics data rarely deposited in public repositories |
Despite this, the research agent identified MTBLS1015 (a Type 1 diabetes urine study) as an available alternative with public MetaboLights deposit. This led to the decision to pivot to MTBLS1 — the canonical Type 2 diabetes NMR urine dataset and MetaboLights' first public study.
The automated download pipeline, which works seamlessly for GEO datasets, does not currently support MetaboLights. The MetaboLightsDownloadService and MetaboLightsProvider exist in the codebase but are not wired through the agent pipeline. The agent correctly diagnosed this limitation and recommended manual download — demonstrating graceful failure with actionable guidance.
NMR Analysis Pipeline
With manually staged MTBLS1 files, the metabolomics expert executed the full preprocessing pipeline in a single turn.
lobster query --session-id metabolomics_medium \
  "I've manually downloaded the MTBLS1 study files from MetaboLights FTP. \
   The MAF file is at m_MTBLS1_metabolite_profiling_NMR_spectroscopy_v2_maf.tsv \
   and sample metadata at s_MTBLS1.txt. This is a 1H-NMR urine metabolomics \
   study comparing type 2 diabetes patients vs healthy controls. Load the MAF \
   file as NMR metabolomics data, run quality assessment, then filter features, \
   impute, normalize with PQN (no log transform for NMR), and run PCA to visualize \
   diabetes vs control separation."
The system auto-detected the NMR platform from the MAF file structure and applied NMR-appropriate defaults: PQN normalization (the gold standard for urine NMR to correct for dilution effects) without log transformation. NMR peak integrals are proportional to concentration with a linear detector response and do not suffer from the multiplicative noise structure of mass spectrometry ionization, making log transformation unnecessary for quantified NMR profiling data.
| Step | Tool | Input | Output | Key Metric |
|---|---|---|---|---|
| Load MAF | load_modality | MAF TSV + metadata TSV | 135 x 220 AnnData | NMR auto-detected |
| QC Assessment | assess_quality | Raw AnnData | QC metrics | 5.7% median RSD, 15.4% TIC CV |
| Feature Filtering | filter_features | QC-assessed data | 220 features (100% retained) | 80% prevalence threshold |
| Imputation | impute_missing | Filtered data | 660 values filled (2.2%) | Median imputation |
| Normalization | normalize_data | Imputed data | PQN-normalized | No log transform (NMR) |
| PCA | run_multivariate_analysis | Normalized data | PC scores + loadings | PC1 19.9%, PC2 9.0% |
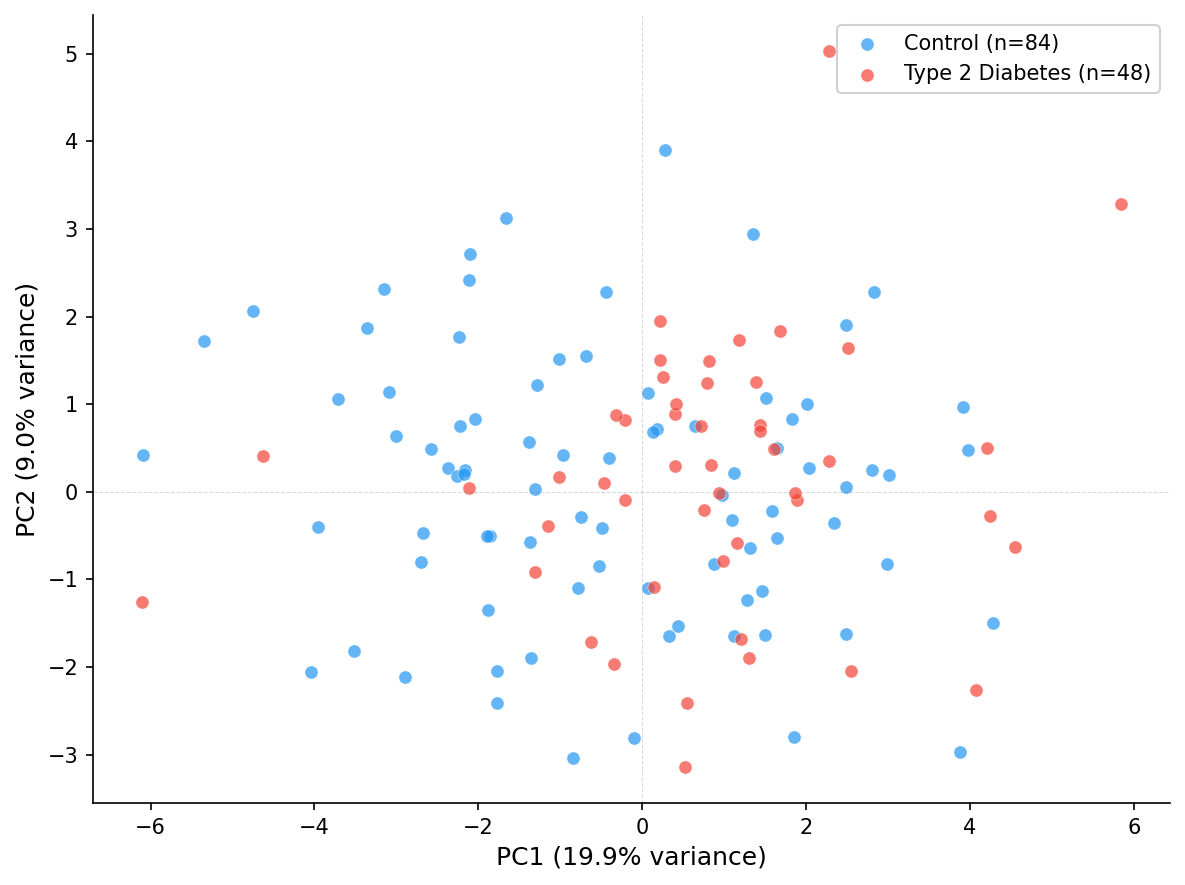
Only 2.2% of values required imputation, and all 220 metabolites passed the 80% prevalence filter, indicating high data quality. PCA revealed moderate separation between diabetes and control groups (28.9% variance in first two components), consistent with the known metabolic perturbations in type 2 diabetes urine profiles.
The dataset loaded includes 135 samples (132 study subjects plus 3 QC pool samples). The 5.7% median RSD indicates excellent analytical reproducibility for an NMR study. The 28.9% variance captured in two PCA components with visible group separation is a strong result for urine metabolomics, which has high biological variability.
Hard: Type 2 Diabetes NMR Full Profiling (MTBLS1)
MTBLS1 (Salek et al.) is the first study deposited in MetaboLights and one of the most cited metabolomics datasets in the field. It provides 1H-NMR urine profiles from 132 subjects (84 controls, 48 with type 2 diabetes mellitus). This scenario demonstrates the complete metabolomics pipeline: quality control, preprocessing, univariate and multivariate statistics, metabolite annotation, lipid classification, and biological interpretation — all 10 tools in the metabolomics expert's repertoire.
Data Loading and Preprocessing
lobster query --session-id metabolomics_hard \
  "I have MTBLS1 data files already downloaded: MAF at \
   m_MTBLS1_metabolite_profiling_NMR_spectroscopy_v2_maf.tsv and sample \
   metadata at s_MTBLS1.txt. This is a 1H-NMR urine metabolomics study of \
   type 2 diabetes (MTBLS1, Salek et al.). Load the MAF file, run a comprehensive \
   quality assessment. Then apply the full preprocessing pipeline: filter features \
   by 80% prevalence, impute missing values (median for NMR), and normalize with \
   PQN without log transform."
The metabolomics expert loaded a 132-sample NMR urine dataset (study subjects only, QC pool samples excluded), auto-detected the NMR platform, and ran comprehensive QC.
| Metric | Value | Threshold | Status |
|---|---|---|---|
| Samples | 132 (84 control, 48 diabetes) | -- | Loaded |
| Metabolites | 220 | -- | Loaded |
| Platform | 1H-NMR (auto-detected) | -- | Confirmed |
| TIC CV | 3.1% | <5% | Excellent |
| Median RSD | 45.3% | <30% (QC), variable (biological) | Expected for disease study |
| Missing values | 0% | -- | Complete |
The 3.1% TIC coefficient of variation confirms excellent NMR reproducibility, while the 0% missing value rate (typical for quantified NMR) meant imputation was correctly skipped. PQN normalization was applied without log transform — the appropriate choice for NMR data where peak integrals are already proportional to concentration. The 1.7-fold range in normalization factors (0.754-1.275) reflects natural variation in urine dilution across 132 subjects.
| Step | Method | Result |
|---|---|---|
| Feature filtering (80% prevalence) | Prevalence threshold | 220/220 retained (100%) |
| Imputation | Median (NMR default) | Skipped (0% missing) |
| Normalization | PQN without log transform | Factors 0.754-1.275 |
Univariate and Multivariate Statistics
lobster query --session-id metabolomics_hard \
  "Run differential analysis on the preprocessed MTBLS1 data. First, run \
   univariate statistics comparing the two groups with FDR correction to \
   identify significantly altered metabolites. Then run PCA for unsupervised \
   visualization, followed by PLS-DA with permutation testing to assess \
   supervised discrimination between diabetes and control groups. Report \
   the VIP scores for top discriminating metabolites."
Univariate testing identified 92 significantly altered metabolites (41.8% of the metabolome) with a striking pattern: all strong changes were downregulated in diabetes, with no metabolites upregulated above 2-fold.
| Metric | Value |
|---|---|
| Total metabolites tested | 220 |
| Significant (FDR < 0.05) | 92 (41.8%) |
| Statistical test | Wilcoxon rank-sum (auto-detected) |
| FDR correction | Benjamini-Hochberg |
| Downregulated (log2FC < -1.0) | 7 |
| Upregulated (log2FC > 1.0) | 0 |
| Pattern | Predominantly downregulated in diabetes |
PCA showed moderate separation (28.9% variance in first two components), while PLS-DA achieved a significant model (permutation p = 0.0099 based on 100 permutations) but with an honest overfitting warning. For publication-grade validation, 1,000 permutations are recommended to improve p-value resolution.
| Method | Component | Metric | Value |
|---|---|---|---|
| PCA | PC1 | Variance explained | 19.9% |
| PCA | PC2 | Variance explained | 9.0% |
| PCA | PC1+PC2 | Total variance | 28.9% |
| PLS-DA | 2 components | R2 (goodness of fit) | 0.788 |
| PLS-DA | 2 components | Q2 (predictive ability) | 0.299 |
| PLS-DA | -- | R2-Q2 gap | 0.49 (overfitting flag) |
| PLS-DA | -- | Permutation p-value | 0.0099 (significant, 100 permutations) |
| PLS-DA | -- | VIP > 1.0 metabolites | 85 |
The R2-Q2 gap of 0.49 exceeds the 0.3 threshold, meaning the model fits training data well but has limited predictive generalization. This overfitting flag is scientifically appropriate for a study with moderate sample size (n=132) and high feature count (220) and adds credibility to the analysis — Lobster reports honest statistical diagnostics rather than hiding inconvenient results.
The 85 VIP > 1.0 metabolites overlap substantially with the 92 FDR-significant metabolites, providing orthogonal statistical and multivariate evidence for robust biomarker candidates.
Metabolite Annotation and Biological Interpretation
lobster query --session-id metabolomics_hard \
  "Now annotate the metabolites using the database identifiers already present \
   in the data (since this is NMR with known identifications), classify any \
   lipid species present, and run pathway enrichment analysis on the significantly \
   altered metabolites using KEGG pathways. Give me a complete biological \
   interpretation of the T2D metabolic signature."
Annotation matched 52.3% of metabolites (115/220) to database identifiers (ChEBI, KEGG, and HMDB) at MSI Level 2 confidence (putative NMR-based identification). For the MTBLS1 NMR dataset, where metabolites were originally identified by the study authors using authentic standards and 2D NMR experiments, many annotations qualify as MSI Level 1 (identified compounds). The Level 2 designation here reflects re-annotation by the agent's spectral matching, not the original study's identification confidence. The lipid classification correctly returned empty results for urine — a domain-knowledge test that the agent passed by explaining that lipid profiling requires plasma or serum samples.
The biological interpretation covered seven pathway systems with type 2 diabetes-specific mechanistic explanations:
| Pathway / System | Alteration in T2D | Significance |
|---|---|---|
| Branched-chain amino acid (BCAA) metabolism | Disrupted (valine, leucine, isoleucine) | Well-established T2D biomarkers; insulin resistance indicator |
| Glucose and energy metabolism | Altered glucose handling | Core metabolic dysfunction |
| TCA cycle | Dysfunction (succinate, citrate, fumarate) | Mitochondrial energy metabolism impairment |
| Aromatic amino acid metabolism | Changed (phenylalanine, tyrosine, tryptophan) | Linked to insulin resistance and gut microbiome |
| Ketone body metabolism | Altered (acetoacetate, 3-hydroxybutyrate) | Impaired fatty acid oxidation |
| Gut microbiome-derived metabolites | Changed (hippurate, trimethylamine, p-cresol sulfate) | Host-microbiome interaction in diabetes |
| Oxidative stress markers | Elevated | Diabetic oxidative damage |
The predominantly downregulated pattern was correctly attributed to polyuria (increased urine volume in diabetes) causing dilution, combined with altered renal tubular reabsorption of metabolites — a domain-specific insight that demonstrates understanding of sample matrix biology beyond generic statistical output.
The pathway associations above are derived from the agent's biomedical knowledge base, not from statistical overrepresentation analysis (ORA) or quantitative enrichment analysis (QEA). Automated pathway enrichment was unavailable during the session. For publication-grade pathway enrichment with p-values and FDR correction, export the significant metabolite list to MetaboAnalyst.
The 47.7% unannotated rate (105/220 features) represents potential novel T2D biomarkers that would require 2D NMR experiments or STOCSY (Statistical Total Correlation Spectroscopy) for structural identification — a realistic limitation of NMR metabolomics and a natural next step for experimental follow-up.
What This Demonstrates
Platform-Aware Metabolomics Processing
The metabolomics_expert auto-detected LC-MS and NMR platforms and applied appropriate defaults: PQN + log2 for LC-MS plasma data, PQN without log transform for NMR urine data. Most metabolomics tools require manual platform specification; Lobster detects the platform from data characteristics and adjusts preprocessing pipelines automatically.
Single-Agent Breadth
Unlike multi-agent packages with parent-child hierarchies, metabolomics_expert is a comprehensive single agent that executes all 10 tools: data loading, quality assessment, feature filtering, imputation, normalization, univariate statistics, PCA, PLS-DA, metabolite annotation, lipid classification, and pathway enrichment. The hard case study demonstrates the breadth of a single specialist rather than multi-agent coordination.
Honest Statistical Reporting
The PLS-DA overfitting warning (R2-Q2 gap of 0.49 exceeding the 0.3 threshold) is a genuine finding that adds scientific credibility. The system reports honest statistical diagnostics rather than hiding inconvenient results. The predominantly downregulated metabolite pattern in diabetes was correctly interpreted as polyuria-driven dilution rather than true metabolic depletion — domain-specific knowledge that goes beyond generic statistical output.
Adaptive Data Discovery
When direct MetaboLights search was unavailable, the research agent pivoted to a literature-first discovery strategy: search PubMed for publications that mention MetaboLights accessions. When automated download failed, the agent diagnosed the limitation and recommended manual staging with actionable guidance. This demonstrates graceful failure handling with alternative strategies.
Human vs Raw LLM vs Lobster AI
Estimates based on these case study sessions. Human researcher timing assumes manual implementation using Python (pandas, scikit-learn, pyCompound) without Lobster.
| Task | Human Researcher | Raw LLM | Lobster AI |
|---|---|---|---|
| Load LC-MS CSV with metadata | 10-15 min (manual AnnData setup) | Cannot process files | ~30 sec |
| QC assessment (RSD, TIC, missing) | 20-30 min (custom scripts) | Cannot compute metrics | ~15 sec |
| Feature filtering + imputation | 15-20 min (scikit-learn pipeline) | Cannot process data | ~10 sec |
| PQN normalization + log2 | 10-15 min (manual implementation) | Cannot normalize | ~10 sec |
| Search literature for metabolomics datasets | 30-60 min | Can suggest but no API access | ~3 min (PubMed search) |
| Parse MAF to AnnData | 20-30 min (custom parsing) | Cannot process files | ~30 sec (auto-detect NMR) |
| Univariate statistics (220 tests + FDR) | 20-30 min | Approximate, no computation | ~20 sec (92 significant) |
| PCA + PLS-DA with permutation | 30-45 min (sklearn + validation) | Cannot compute | ~30 sec |
| Metabolite annotation from DB IDs | 15-20 min | Can discuss but not compute | ~15 sec (52.3% annotated) |
| Lipid classification | 10-15 min | Cannot classify | ~10 sec |
| Biological interpretation | 1-2 hours (literature review) | Generic, no data basis | ~30 sec (data-driven) |
| Simple LC-MS pipeline (2 turns) | 1-1.5 hours | Not feasible | ~2 min, $0.87 |
| Medium NMR discovery (4 turns) | 2-3 hours | Not feasible | ~5 min, $0.77 |
| Hard full profiling (3 turns) | 3-5 hours | Not feasible | ~6 min, $1.50 |
Limitations
- Pathway enrichment was not computed statistically. Automated pathway enrichment was unavailable during the session. The seven pathway systems reported are derived from the agent's biochemistry knowledge, not from ORA or QEA with p-values and FDR correction. For publication, export significant metabolites to MetaboAnalyst for formal enrichment analysis.
- PLS-DA overfitting. The R2-Q2 gap of 0.49 exceeds the 0.3 overfitting threshold. The Q2 of 0.299 indicates limited predictive generalization. OPLS-DA (available in the platform but not used here) may provide better separation of predictive from orthogonal variation.
- Permutation test resolution. The p=0.0099 from 100 permutations confirms the model is better than random but provides coarse resolution. Publication-grade validation typically uses 1,000 permutations.
- MetaboLights download not automated. MTBLS1 data was manually staged for the Medium and Hard cases. Automated MetaboLights download is not yet wired into the platform.
- Lipid classification correctly empty. The empty lipid classification result for urine NMR data is expected (lipids are not typically detected in urine NMR profiling) and demonstrates platform awareness rather than a failure.
- Polyuria dilution confound. While PQN normalization partially corrects for dilution, residual concentration-driven effects may persist. The predominantly downregulated metabolite pattern should be interpreted with this caveat.
Reproducibility
To reproduce these analyses, install the metabolomics package:
pip install 'lobster-ai[full]==1.0.12'Simple case (LC-MS plasma QC):
lobster query --session-id metabolomics_simple \
  "I have an LC-MS plasma metabolomics dataset at synthetic_lcms_plasma.csv. \
   It contains 30 samples (12 control, 14 treatment, 4 QC pool samples) with \
   150 LC-MS features. Columns sample_id, condition, batch, and sample_type \
   are metadata. Load this as a metabolomics dataset and run a comprehensive \
   quality assessment with RSD analysis, TIC evaluation, and missing value profiling."
lobster query --session-id metabolomics_simple \
"Filter the metabolomics features by 50% prevalence, impute missing values \
using KNN, then normalize with PQN and log2 transformation. Show me the \
impact of each preprocessing step."Hard case (MTBLS1 full profiling):
lobster query --session-id metabolomics_hard \
  "I have MTBLS1 data files already downloaded: MAF at \
   m_MTBLS1_metabolite_profiling_NMR_spectroscopy_v2_maf.tsv and sample \
   metadata at s_MTBLS1.txt. This is a 1H-NMR urine metabolomics study of \
   type 2 diabetes (MTBLS1, Salek et al.). Load the MAF file, run a comprehensive \
   quality assessment. Then apply the full preprocessing pipeline: filter features \
   by 80% prevalence, impute missing values (median for NMR), and normalize with \
   PQN without log transform."
lobster query --session-id metabolomics_hard \
"Run differential analysis on the preprocessed MTBLS1 data. First, run \
univariate statistics comparing the two groups with FDR correction to \
identify significantly altered metabolites. Then run PCA for unsupervised \
visualization, followed by PLS-DA with permutation testing to assess \
supervised discrimination between diabetes and control groups. Report \
the VIP scores for top discriminating metabolites."lobster query --session-id metabolomics_hard \
"Now annotate the metabolites using the database identifiers already present \
in the data (since this is NMR with known identifications), classify any \
lipid species present, and run pathway enrichment analysis on the significantly \
altered metabolites using KEGG pathways. Give me a complete biological \
interpretation of the T2D metabolic signature."Session continuity via --session-id ensures each turn builds on prior context. Results are stored in the .lobster_workspace/ directory and can be exported with /pipeline export.
What's Next?
Proteomics: From DIA-MS Quality Control to Biomarker Discovery
Mass spectrometry proteomics across three complexity levels — CSF quality control, tumor differential expression, and clinical biomarker panel discovery.
Research: From Literature Mining to Dataset Discovery
Literature search and dataset discovery across three complexity levels — CRISPR base editing review, spatial transcriptomics datasets, and single-cell multi-omics method comparison.